DevOps Troubleshooting Concept
The phrase “DevOps” means a lot of different things to different people because the discussion around it covers a lot of ground. People talk about DevOps as developer and operations collaboration, integration, automation, and the measurement of cooperation between software developers and other IT professionals.
- Enabling communication/collaboration between all stakeholders that take part in the application delivery process.
- Automating as much as possible in the application delivery to reduce variability and maximize velocity.
- Integrating the application Delivery steps and tooling for effective and efficient delivery.
- Establishing a learning and improvement culture that attempts to optimize the application delivery process from a customer perspective. This can only be achieved from an end-to-end perspective.
In this blog, I’ll focus on collaboration between software developers and other IT professionals.
What is DevOps?
Typically, there is a gap in between developers, QA, and system admins while troubleshooting. This is where DevOps comes into the picture, because it is where developers, Quality Assurance, and system administrators work together to deliver the application at the speed of the business.
The Concept of Troubleshooting
Troubleshooting as a skill is a logical, systematic search for the source of a problem in order to solve it so the product or process can be made operational again.
In a DevOps organization, everyone on the team is responsible for some level of troubleshooting. A developer troubleshoots bugs in their software, a system admin troubleshoots problems in servers and networks, and the QA team spends time first finding problems and then trying to locate the root cause. When everyone on the DevOps team uses the same proven troubleshooting techniques, the whole team benefits.
How to troubleshoot effectively:
- Divide the problem space
- Practice good communication when collaborating, including conference calls, direct conversation, email, and real-time chat rooms
- Document your problems and solutions
- Understand how the systems work
- Favor fast solutions
- Know what has been changed
Problem: Application Performance Issue
An application performance issue can be seen in any organization and multiple things, including errors in the web server, code, database, server, or network, may cause one. First, you must find the cause of the problem. Sometimes, it’s inflexible to come to a conclusion by following a step-by-step procedure.
Because performance testing is an iterative process, it’s essential to document the test results and the configuration settings for all iterations.
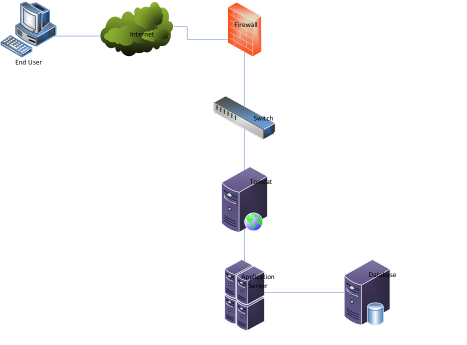
Example Scenario:
End-User Troubleshooting
- Access the application from the browser and check how much time it takes to load the page.
- Check the ping response of the server from the user side. An appropriate response denotes that the connectivity for the server and the user machine is good.
Web Server Troubleshooting
- If the web server process is running, check how many processes are running. If it’s more than 50, it indicates that there is an issue such as high user traffic, high CPU utilization, or high disk I/O.
- Check memory status and CPU utilization to see if any web service processes are consuming a high CPU usage by using the appropriate commands.
- Verify web server logs and look for errors in the error and access logs.
Java-Based Application Troubleshooting
- Check the Java processes and the load average for the instance machine by using the command ps –ef|grep java. The load average can give you substantial clues toward where the problem lies.
- Check the Tomcat logs, which can be found in TOMCAT_HOME/logs, and search for the exceptions.
Server Troubleshooting
- Verify the website status with the telnet command to check # telnet IP_Address port. Also, run tracert to check the SPF and latency of the website.
- Check whether FQDN is resolving by the DNS server with # nslookup IP_Address. Most of the time the DNS server will find the culprit and resolve the FQDN hostname.
- Check the server for slow performance, or whether it’s running out of CPU, RAM, and Disk with the ‘top’ command.
Database Troubleshooting
- Depending on the distribution, check the logs for any errors.
- Check for slow queries with database metrics, such as Uptime, Threads, or Slow Queries. You can also do this by using the extended-status command. Also, check the process list waiting in the queue, which can also be checked with other databases.
mysqladmin -u root -p status
Enter password:
Uptime: 2680987 Threads: 1 Questions: 17494181 Slow queries: 0 Opens: 2096 Flush
Table’s: 1 Open tables: 64 Queries per second avg: 6.525
Tune for better performance
- Application Code: if the database connection from the application code is not closed properly.
- Database Tuning: if the database response is slow, then it delays any responses to queries.
- JVM Tuning: Every application has its own memory requirement. Issues will occur if an application has a huge memory requirement but is allocated less than OOM (Out of memory).
- Middleware Services: if there are application connectivity issues with the external interface.
- Infrastructure & OS: if there are internet connectivity issues with the network, packet drop in the network.
Recent blog posts

Stay in Touch
Keep your competitive edge – subscribe to our newsletter for updates on emerging software engineering, data and AI, and cloud technology trends.


